Real Time Data Analytics For Inventory

Real Time Data Analytics for Inventory

Real Time Data Analytics For Inventory
Real Time Data Analytics for Inventory

In today times, it just not enough for any Retailer or MSME Trader to prepare MIS at the end of each month for slow moving items or dead stock reports.

In current scenario, when business is operating effectively just for 6 months in year due to lot of future uncertainties, entrepreneurs get very less time to implement corrective actions. So we need to approach our problem more scientifically and analyse the past data to understand the future trends to take better decisions. We need to have live dashboards connected to our database and have 360 degree view of it. 

We can look at one of the Practical Case study example where client is looking for solutions as below

Problem Statement

  1. Reduce inventory investment by 30%
  2. Institute a program to prevent the build up of obsolete inventories by disposing of slow movers on a regular basis.
  3. Demand planning/ Forecasting

Data Collection

  1. Sale Transaction Order History 
  2. Purchase Transaction History
  3. Live inventory Data
  4. Product Item Dataset (Item Description, Price, Quality Features, Product Segments)

Case Analysis

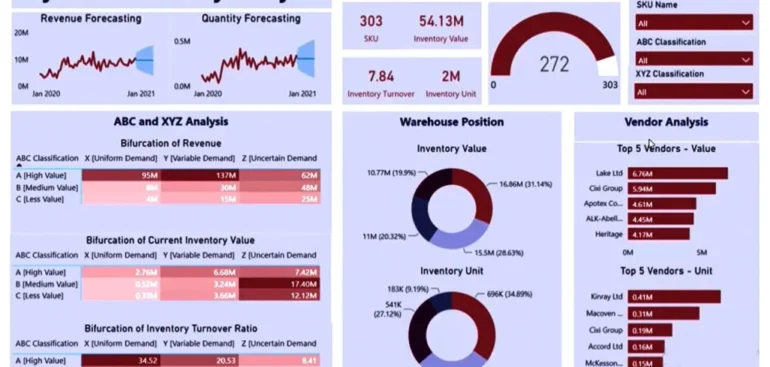
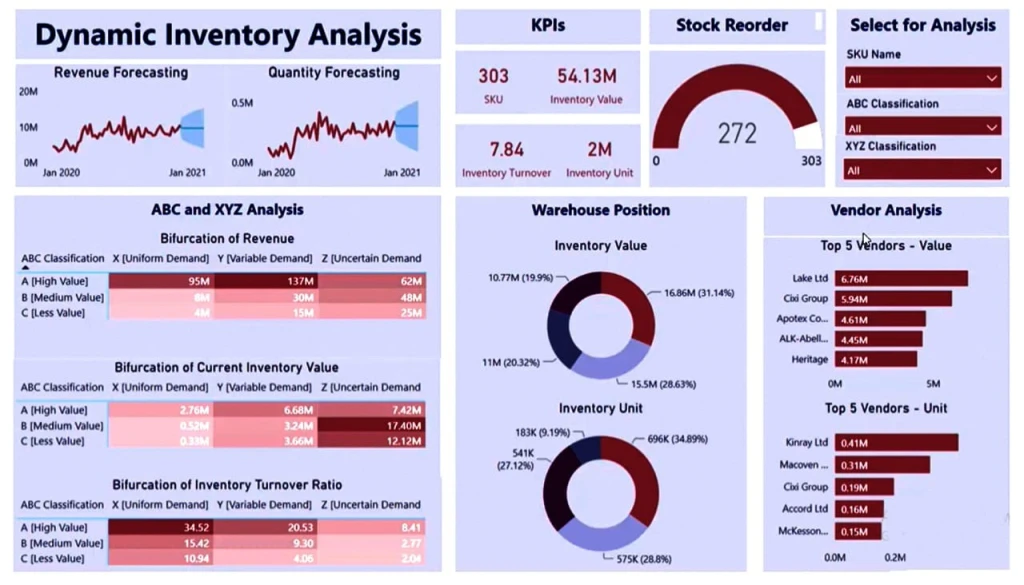
  1. Inventory has to be analysis in terms of value i.e. ABC analysis and even in variability of demand factor i.e. XYZ Analysis
  2. Inventory lying in warehouse has to be analysed with its prospective customers for better engagement

Solution Statement

  1. What we found that two product in terms of value which was coming in X” category was not marketed to customers properly.
  2. Client was buying huge quantities of irregular demand product which comes in Z” category but in value terms it was coming under A” category so investment of client could be reduced by 15% percent.

Conclusion

In this new age data analysis, Inventory data cannot be seen in silo, we need to compare with its vendors database, customer database, product universe, external factors for the right approach of decision making.

In simpler terms, Inventory management means the technique to determine the optimum level of inventory at firm level and for each SKU of the product range. Now to do same u need to apply Data Science and Visualisation Analytics tools to take better decisions.

Share

Facebook
Twitter
LinkedIn

Subscribe

The Remission of Duties and Taxes on Exported Products (RoDTEP)​

rodtep

The Remission of Duties and Taxes on Exported Products (RoDTEP)

rodtep

Centre Notifies RoDTEP Scheme Guidelines and Rates Scheme to boost our exports & competitiveness Sectors like Marine, Agriculture, Leather, Gems & Jewellery, Automobile, Plastics, Electrical / Electronics, Machinery get the benefits of Scheme.

Rates of RoDTEP to cover 8555 tariff lines

The Remission of Duties and Taxes on Exported Products (RoDTEP) came into effect on 1 January, but guidelines and rates for export items were not announced then. The commerce ministry notified RoDTEP rates on 17 August.

RoDTEP refund range (in%)

Textiles0.5-4.38,555
Food0.5-2.5The number of products in India’s export basket that are likely to get the benefit
  Plastics and rubber  0.5-2.4 
  Aluminum and Zinc  0.5-2.3 
Machinery0.5-2.2 
Auto and ancillaries   Products of chemical0.5-2.0Rs.12,454 crore
The total amount the refund is expected to cost
or allied industries0.5-1.7 
Gems and jewellery0.01 


1.What is RoDTEP scheme?

The Remission of Duties and Taxes on Exported Products (RoDTEP) scheme reimburses central, state and local taxes that are not refunded under any other scheme to exporters. Under existing rules, goods and services tax (GST) and customs duties for inputs required to manufacture export products are either exempted or refunded. However, certain duties are outside the ambit of GST and are not refunded to exporters, such as value-added tax on transportation fuel, mandi tax and duty on electricity for manufacturing. RoDTEP has replaced the earlier Merchandise Exports from India Scheme (MEIS).

2.What are the features of the scheme?

The scheme came into effect on 1 January, but since guidelines and rates for export items were not announced, exporters were unable to benefit from it. The commerce ministry notified RoDTEP rates on 17 August. The scheme, with a budget of Rs. 12,454 crore for FY22, will be available for 8,555 export items in sectors such as marine, agriculture, leather, gems and jewellery, automobiles, plastics, electrical and electronics, and machinery. The government has announced a separate Rebate of State and Central Levies and Taxes (RoSCTL) scheme for garment exports with a budget outlay of around Rs. 6,946 crore for FY22.

3.Are some sectors excluded from RoDTEP?

Yes; exporters in sectors like iron and steel, mineral products, pharmaceuticals and chemicals have been kept out of the scheme because the Centre thinks the sectors are doing well on their own and given the tight fiscal situation, it won’t be possible to cover these sectors in FY22. Products manufactured in export-oriented units and special  economic  zones  are  also  not covered.

4.How does the new scheme work?

The refunds for the taxes paid by exporters under the scheme would be credited to an exporter’s ledger account with the customs, and can be used to pay basic customs duty on imported goods. The credits can also be transferred to other importers. The rebate will have to be claimed as a percentage of the freight-on-board value of exports. For certain export items, a fixed quantum of rebate amount per unit may also be notified. A monitoring and audit mechanism has been put in place to physically verify the records on a sample basis.

Share

Facebook
Twitter
LinkedIn

Subscribe

More articles

No posts found

Gather Actionable Customer Insights

Gather Actionable Customer Insights

In the previous blog, we discussed about what is data analytics and in what business functions it can be used practically for any B2C or Retail Companies. So here comes the first actionable insights to be gathered from customer data analytics. 

The purpose of business is to create and keep a customer. This statement was made by Peter Drucker, the acclaimed 20th-century management consultant. A simple statement that reveals in just a few words that the long-term viability of a company is not just about maximizing revenue and minimizing costs. Long-term viability is about understanding what it takes to attract customers by continuing to meet and exceed their physical and psychological needs.

What Is Customer Analytics


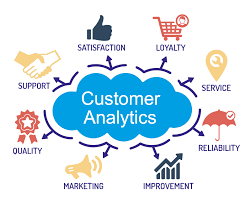
Customer Analytics is understanding of Use of Data to understand Composition, Needs, Behaviour, Attitude, Satisfaction of the Customer to undertake targeted marketing & sales decisions in online and offline mode. 

Why customer data analytics is required :

Marketing & service differentiation :


    • Improve marketing focus having different tastes,values and reasons to purchase 
    • Build loyal customers and create personas as representative customers

Product and lifecycle :


    • Predict future purchasing patterns
    • Customise products to different individual groups 

Price :


    •   Price products or promotions differentially to increase sales
    •   Willingness to pay for optimal price.

    What has to be the outcome of customer data analytics 

    How to Do Customer Analytics in 4 Simple Steps 


    1.Customer segmentation : 


    Mainly can be divided only on the basis of

      • Geography
      • Demography
      • Behavior
      • Psycho-graphic

    There are different models like RFM (Recent Frequency Monetary Value), Clustering, ABC Customer Analysis, Clustering, Factor Analysis

    2.Measuring Key Operations Metrics : 


    It will improve the understanding of the customers and health of the customers organisation from the customer’s point of view.

      • Customer Acquisition Cost 
      • Customer Lifetime Value 
      • Customer Churn Ratio
      • Net Promoter Score Card
  •  

    3.Customers need/want :


    It has been analysed from the perspective of  Why, Where, How, and When is buying or engaging with the products or services. 

    Collecting the right data through feedback, surveys, market research, competitor mapping and transaction data will ensure answers. 

    4.Marketing Mix models like :


    Above-the-line media activity (TV, print ads, digital ads, promotions, and discounts, etc.)   

    Below-the-line factors (temporary selling prices, sales promotions, discounts, social media, direct mail marketing campaigns, in-store marketing, events, and conferences, meetings.)

    A/B testing models can be applied to understand the effectiveness of each marketing campaign.

    Conclusion:


    Data is a new oil engine for any business which has to be effectively collected, measured and monitored to gather actionable insights for business decisions. Customer analytics helps drive in customer acquisitions at lower costs, able to retain customers more effectively with personalised targeting and recommendations. One example of best customer retention is Groccery Shop (Pan ki dukaan) who has maintained loyal customers through years and years by providing the personalised customer service with great experience. We all can use Customer Data to provide the same with minimum human interaction. 

Share

Facebook
Twitter
LinkedIn

Subscribe